Environmental factors affecting photosynthesis
Author(s):
Summary: This lesson plan has been prepared in accordance with the acquisition of “It makes inferences about the factors affecting photosynthesis speed.” The aim is to comprehend that the speed of light changes with the change of the wavelength of the light, to obtain the product by using the robotic coding and STEM steps. In the coding mechanism, observations are made by using 3 different colored lamps, and then, it is aimed to make the students draw graphics with the findings obtained by using their analytical thinking skills.
| Lesson plan summary | |
| Subject | Green Chemistry / Green Biotechnology / Green Engineering and Robotics |
| Topic | Effect of light wavelength on photosynthesis |
| Age of students | Secondary 12-14 |
| Preparation time | 15 Minutes |
| Teaching time | 2*40 Minutes |
| Online teaching material (links for online material) | 1)https://www.youtube.com/watch?v=Aggi0g67uXM |
| Offline teaching material |
Aim of the lesson
By the end of this lesson students will:
• realize that the wavelength of light affects the speed of photosynthesis.
· discover how the speed of photosynthesis changes with different colors of light.
· be able to prepare experimental designs with robotic materials by using STEM steps.
· acquire scientific literacy skills.
· realize that scientific process skills, conceptual permanence and positive attitude towards the course are developed.
Trends
STE(A)M Learning / Collaborative Learning / Problem-based learning
Activities
Describe here in detail all the activities during the lesson and the time they require. Remember, that your lesson plan needs to revolve around the topic of green engineering and robotics.
| Name of activity | Procedure | Time |
| Engage-1 | https://www.youtube.com/watch?v=Aggi0g67uXM The teacher enables the students to watch the video about the color of the light. Then the teacher asks the students “What kind of effect can light color have on plants?” and asks students to share their ideas. | 5 min |
| Explore-1 | After the video, which was watched in the engage part, the students were asked “If you had a plant which of the yellow-green-red colors that are formed after the white color is broken in the prism, would you use for this plant to perform photosynthesis?”. students are asked to respond this question by using their imagination. Upon the answers given, students are divided into 3 different color groups. | 10 min |
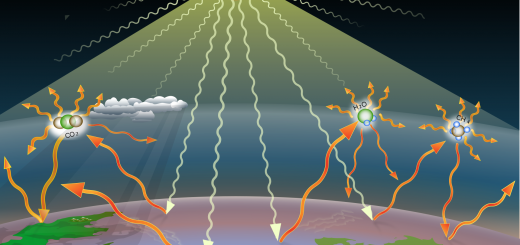
| Explain-1 | Effect of Wavelength of Light on PhotosynthesisMaterial List to be used:1. Arduino Robotic Coding Board2. Mq-1355 Air Quality Measurement Module3. 3 bulbs in Red, Yellow and Green colors4.3 bulb sockets5. Connection cables6. Mblock IDE program   Arduino Uno 2. Mq-1355 sensor 3. Lamps 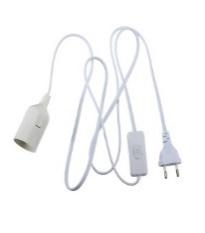 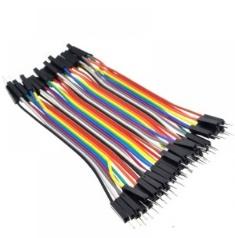  4. bulb holder and cables 5. Connection cables 6. Mblock IDE The Data Obtained: CO2 sensors will be placed in the experimental environments through the circuit to be installed with the above materials, and CO2 sensors will be used to measure CO2 data from experimental environments with the same power of Green, Yellow, and Red light. These data will be between 0-1024 due to the feature of the Arduino Robotic Coding Card. Expectation: In plants that are left to be performed photosynthesis by giving different colors of light with the same power, it is expected that CO2 level decreases in Red light, CO2 level decreases moderately in Yellow light and CO2 level decreases minimally in Green light. A rapid decrease in the amount of CO2 will show that photosynthesis is very high, and a slow decrease will show that photosynthesis is less. | 5 min |
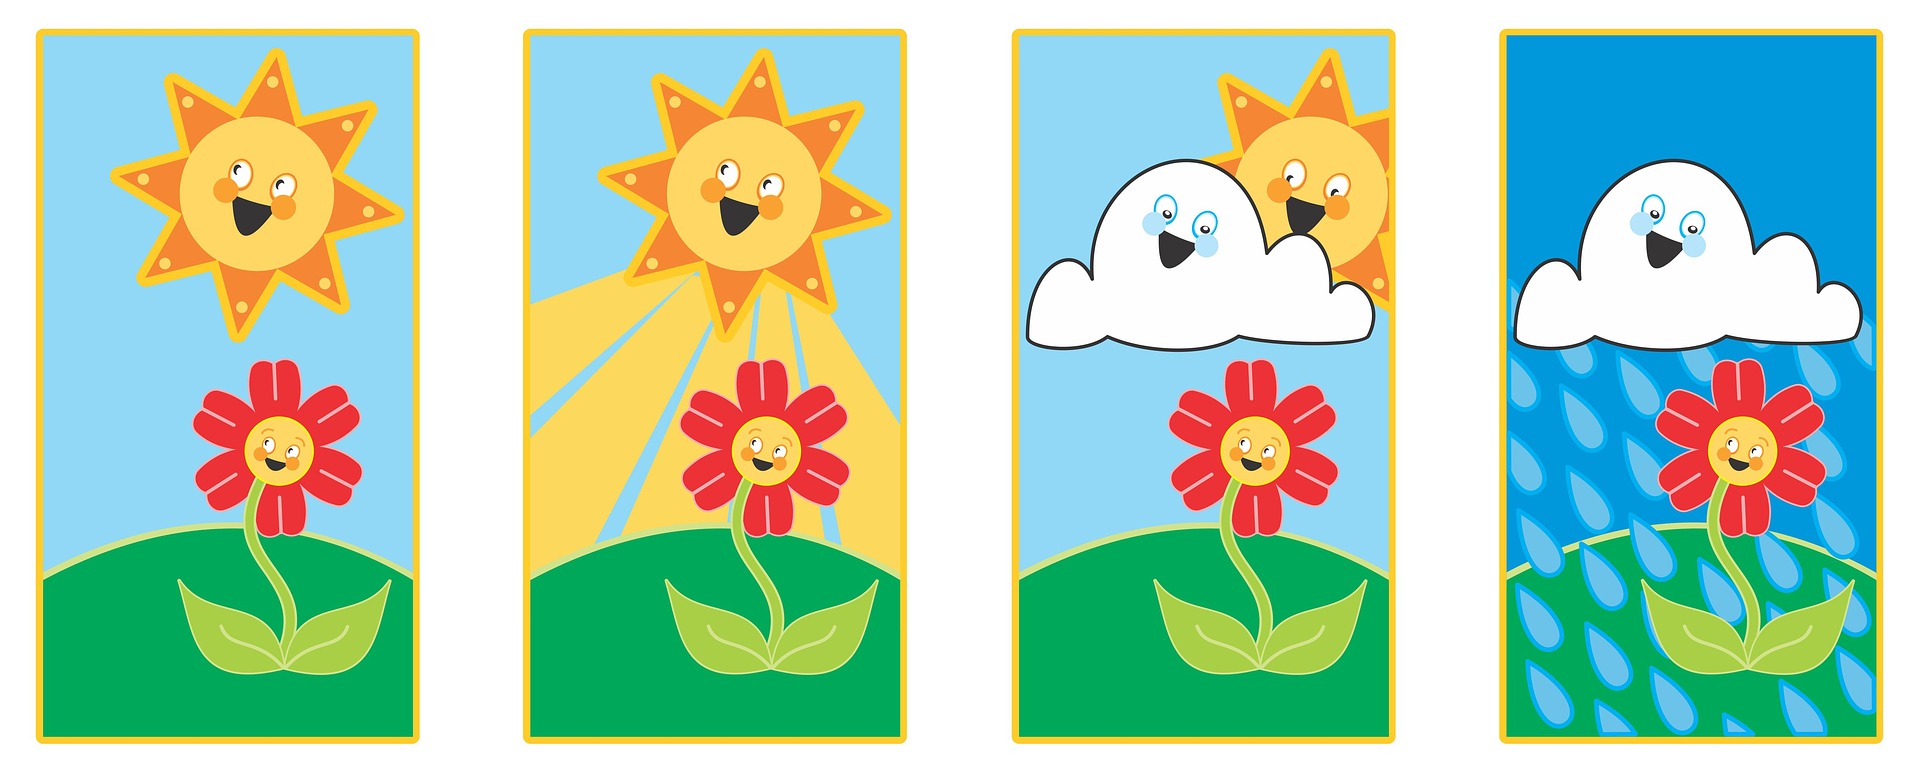
| Elaborate-1 | After giving information about the activity, the necessary information about the subject is presented to the students by the teacher. Then, the activity is done by students divided into color groups. Wavelength of Light Photosynthesis takes place only in visible light, so light with wave-lengths between 380 nM and 750 nM. The wavelengths of the lights from different colors which result from passing the white light through the prism, are also different. As the wavelength increases, the amount of energy that light contains decreases. The use of lights of different wavelengths changes the rate of photosyn-thesis. We need to know the Engelmann Experiment about this. Engelmann Experiment: In this experiment, a thread alga and aerobic, that is oxygen-breathing bacteria were used. The white light, which passes through the prism and separated into colors, is dropped on the thread algae. The aerobic bacteria left in the experimental environment were mostly seen in the parts where the purple and red light reached; the least number of bacteria gathered in the part where green light reached. Photosynthesis speed is high in purple and red light, it is quite low in green light. The reason of this is seeing objects in the color of the light they reflect. Why do we see plants green? Because they reflect the green light in the white light that falls on them. In order for the light to be used in photosynthesis, it must not be reflected and it must be ab-sorbed by chlorophyll. For this reason, the rate of photosynthesis is low in green light. 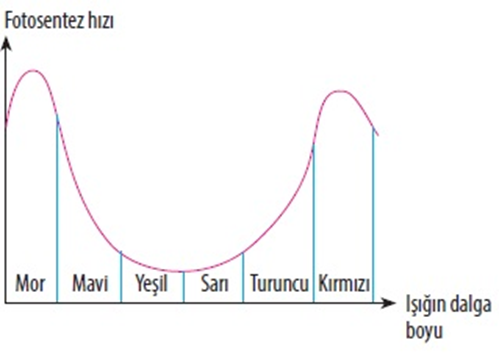 Measuring the Effect of Light Intensity on Photosynthesis Aim: To create the necessary test environment to measure the effect of light intensity on photosynthesis. In order to perform this experiment, CO2 sensor will be used to measure the decreasing CO2 gas after photosynthesis in 2 different experimental environments illuminated with LEDs with different light intensity. Since the CO2 in the environment is converted to O2 by the plants after photosynthesis, we can say that the light intensity used in the experimental environment is accelerating photosynthesis in any experimental environment. Measuring the CO2 Level Inclusion of Mq-135 Sensor in the project: Establishment of an electron-ic and robotic experiment environment to observe the changing CO2 level in the environment: Necessary materials: 1 x Arduino Uno Robotic Coding Board1 x Breadboard3 x Mq-135 CO2 level measurement sensor14 x Jumper cable1 x 3W Red Led Bulb1 x 3W Yellow Led Bulb1 x 3W Green Led Bulb Introduction of Mq-135 Sensor and Pin Outputs:It has 4 pins of the Mq-135 sensor we are using. These are VCC, GND, AOUT and DOUT pins. If it is necessary to define its functions: 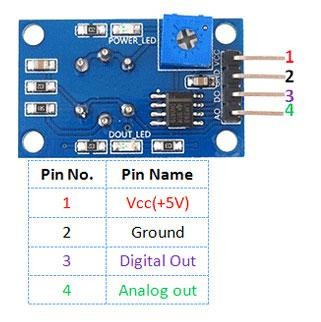 Vcc: Pin to which the voltage required for the operation of the device is given GND: Pin required for the completion of the electrical circuit DOUT: Digital Output Pin of the data from the sensor (0 or 1). AOUT: Analog Output Pin of the data coming from the sensor (0-1024). Making Circuit Connections: We connect the Vcc pins of our CO2 sensors to the Vcc (5V) pin, which we get from Arduino, indicated by the red cable as below. Likewise, we connect the GND pins of our CO2 sensors from the Arduino and connect them to the GND pin, which is indicated by a black cable in the figure below.We connect the AOUT pin of our first Mq-135 sensor to the A0 pin of the Arduino with the green cable as shown below, and place this first sensor in the experimental environment where we light it with a green light. We connect the AOUT pin of our second Mq-135 sensor with the yellow cable to the A1 pin of the Arduino as below figure and place this Second sensor in the experimental environment where we light it with yellow light. We connect the AOUT pin of our third Mq-135 sensor with the orange cable to the A2 pin of the Arduino as below figure and place this third sensor in the experimental environment where we light it with red light. 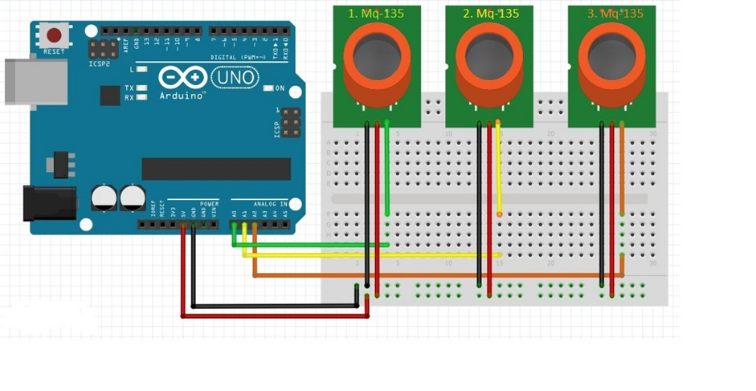 Connection cables diagram between Arduino and Mq-135 Sensors Arduino Mq-1355V ——> Vcc (To activate the device)GND ——> GND (To complete the power circuit)A0 ——> 1. Mq-135 AOUT (To read the data from the sensor)A1 ——> 2. Mq-135 AOUT (To read the data from sensor)A2 ————–> 3. Mq-135 AOUT (to read the data from the sensor) 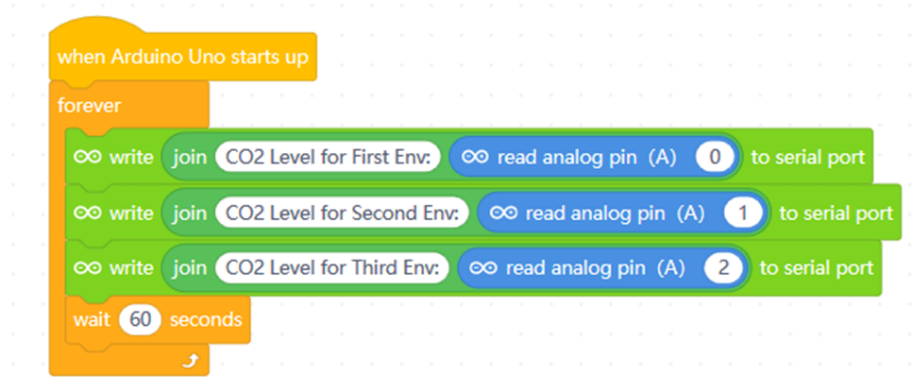 The application we will use for coding is the Mblock program. This application is a tool that allows us to do robotic coding by dragging and dropping blocks without the need for programming language knowledge. The coding block is on top.Application guide: The application we will use for coding is the Mblock program. This application is a tool that allows us to do robotic coding by dragging and dropping blocks without the need for programming language knowledge. The coding block is on top.Application guide:Analog arrow pin (A0) block:Indicates that data from the A0 Analog pin of Arduino is read. Analog arrow pin (A1) block:Indicates that the data from the A1 Analog pin of the Arduino is read read analog pin(A2) block: Indicates that the data from the A2 Analog pin of the Arduino is read Combine block () with ():It is the block that indicates that the text or variables in the second bracket will be combined in the text sent to the computer via USB cable. Write () serial port block:It enables the variable that comes in parentheses to be sent to the computer via serial port (USB cable to the computer). Since there is data from the A0 Analog pin in the parenthesis, the sensor data will go to the computer.  Combine () with () and Write to Serial Port block:It combines what is written in parentheses and sends this value to the Serial port (computer). Here it will combine the “First environment CO2 Level” and the value read from the A0 pin of Arduino (the value from the CO2 sensor) and write to the Serial port (send it to the computer) () sec wait block:When the Arduino Robotic Coding card sees this block, it will wait without doing anything for the given seconds. In our experiment, since we have to get the data every 60 seconds, 60 value was entered into our waiting block.  The block when Arduino Uno starts: This block represents energizing the Arduino Robotic Coding device. It means that code blocks added as a chain will be executed when energized and started to run. Since the “Continuous repeat block” is added as a chain to the “When Arduino Uno starts” block, when the Arduino device is energized, the processes we defined in the “constant repeat block” above will be performed.  Students are expected to read the color graphics that obtained after the activity. Teacher asks again “If you had a plant which of the yellow-green-red colors that are formed after the white color is broken in the prism, would you use for this plant to perform photosynthesis?” and students are expected to answer. | 30 min |
| 5.1.Evaluation | Process EvaluationIn this evaluation phase, the aim is to identify students’ scientific literacy. To this end, the students asked, “If you had a plant which of the yellow-green-red colors that are formed after the white color is broken in the prism, would you use for this plant to perform photosynthesis?” They are asked to interpret the reasons for the change between the first and second answers to the question by looking at the graph in their hands. | 5 min |
| 5.2.Evaluation | Science Course Outcomes: | 5 min |
| F.8.6.2.1. Realize the importance of photosynthesis in food production in plants. a. It is emphasized that carbon dioxide and water are used in photosynthesis, and food and oxygen are produced. It is not entered into the chemical equation.b. It is stated that photosynthesizing living things are producers.c. It is emphasized that photosynthesis can also occur in artificial light. | ||
| F.8.6.2.2. Makes inferences about factors affecting photosynthesis rate. Light color, carbon dioxide amount, water amount, light intensity and temperature are emphasized. | ||
| Mathematics Course Outcomes: | ||
| M.7.4.1. Data Analysis | ||
| Terms or concepts: line graph, circle graph, median, peak value (mode) | ||
| M.7.4.1.1.Creates and interprets a line chart of data. a) Graphic creation studies of two data groups are also included.b) Line charts that cause misinterpretations are also examined. | ||
| M.7.4.1.2. Finds and interprets the average, median and peak value of a data group.a) Studies to understand which of these values are more useful for a given data group are included. Accordingly, information and communication technologies are included when necessary. | ||
| Engineering Science Outcomes: | ||
| – The student reviews the history of measuring instruments and identifies inventions that have contributed to the development of a tool’s functionality. – The student collects the qualitative and quantitative data obtained as a result of the experiments, records and evaluates their observations. Analyzes data using appropriate technology. Realizes the trends and proportional relationships in the data obtained.- Student estimates the performance, reliability and success-failure situations of alternative solutions.- Student uses different mathematical concepts and methods while analyzing the problem.- Realize the importance of precision in measurement and reading measurements in engineering studies.- Applies mathematical formulas or reaches mathematical formulas from the data obtained. | ||
| Social Product Outcomes:Gaining the ability to think analytically in the interdisciplinary information flow, behave consciously towards nature, sharing their opinions with friends, and presenting their products to their friends. | ||
| Materials Used: Materials that are mandatory to use: Grass, night light, soil, sufficiently large flower pot, water.Materials that are not mandatory to use: you can use 3 different materials you want. | ||
| 1. Knowledge Based Life ProblemAli and his friends learned the factors affecting the rate of photosynthesis in Science course. Ali is wondering at which points he encounters this situation in his daily life. While thinking about it, their friends propose to play a football match after school. Ali and his friends decide to play on the grass field with their friends after school. Ali thought the information they had learned in science class along the way. Ali and his friends, who came to the grass field, realized that the grass on the field was very long and they could not play football on this field and returned to their homes. Ali thought about the reason for this situation and concluded that the reason is related to the wavelength of light. Ali wanted to monitor their progress by installing a system like this at home. What kind of way would you suggest to Ali in this situation? Do you help Ali to create a prototype by creating a prototype by yourself? | ||
| Limitations: | ||
| The budget is limited to 50 TL. | ||
| Prototype area should be maximum 1 m2, minimum 0.5 m2. | ||
| Min 2; max 6 different light colors should be used in the prototype. | ||
| Product Evaluation Scale | Should be developed (12 points)Good (16 points)Very good (20 points)Identifying and Analyzing the Problem Finding Possible Solutions and Choosing the Best Making an Example and Testing it Sharing the product Evaluating Your Product and Thinking Better Evaluation of the Product |
Assessment
Describe here the assessment method of the lesson, if any. For example, if you plan on assessing your students with a quiz, include here questions and answer options with color-coding the correct answers.