
Factors affecting photosynthesis

| Lesson plan summary | |
| Subject | Green Engineering and Robotics |
| Topic | Effect of light intensity on photosynthesis |
| Age of students | Secondary 12-14 |
| Preparation time | 15 Minutes |
| Teaching time | 2*40 Minutes |
| Online teaching material (links for online material) | https://www.haberler.com/kapali-seralarda-led-armatur-ile-salatalik-12359201-haberi/https://www.dha.com.tr/ekonomi/kapali-ortamda-led-aydinlatma-ile-domates-yetistirdiler/haber-1640255 |
| Offline teaching material |
Aim of the lesson
By the end of this lesson students will:
- realize that the intensity of light affects the speed of photosynthesis,
- discover how the speed of photosynthesis changes with the intensity of light,
- acquire analytical thinking skills with the information they obtain,
- realize that scientific process skills are developed and positive attitudes towards the course are provided.
Activities
Describe here in detail all the activities during the lesson and the time they require. Remember, that your lesson plan needs to revolve around the topic of green engineering and robotics.
| Name of activity | Procedure | Time |
| Engage-1 | https://www.haberler.com/kapali-seralarda-led-armatur-ile-salatalik-12359201-haberi/https://www.dha.com.tr/ekonomi/kapali-ortamda-led-aydinlatma-ile-domates-yetistirdiler/haber-1640255 | 5 min |
| Explore-1 | After the news in the engage part is discussed, the students are told the following: “While using technology, it is essential to consider the geographical features of the region you are in. this is very important for the method to be used. Then students are asked ‘ if you were a tomato producer living in northern countries, how would you use the light in the most efficient way for your plants to grow?’. Students are asked to answer the question using their own imagination and to say their opinion. | 10 min |
| Explain-1 | Effect of Light Intensity on Photosynthesis Material List to be Used:Arduino Robotic Coding BoardMq-1355 Air Quality Measurement Module2 led bulbs with 500 and 1500 lumens light intensity2 pieces of bulb holderConnection cablesMblock IDE program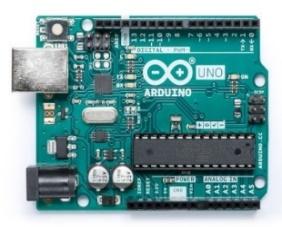 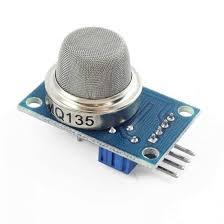 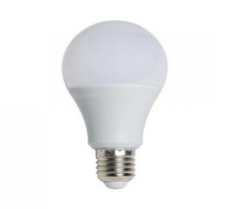 Arduino Uno 2. Mq-1355 sensor 3. Bulb 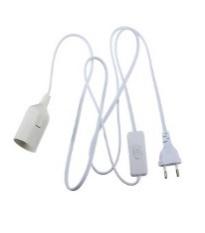   4. bulb holder and cables 5. Connection cables 6. Mblock IDE The Data Obtained:Two experimental setups with different light intensities and the same variables will be established with the above materials. CO2 sensors will be used to measure the CO2 data decreasing from the environments with different intensity values. These data will be between 0-1024 due to the feature of the Arduino Robotic Coding Card. Expectation:As the light intensity increases, the speed of photosynthesis increases to certain level and then continues at a constant speed. It is expected that experiment setups to be installed will perform more photosynthesis in the environment with high luminous intensity and decrease the decrease the CO2 level significantly, and less photosynthesis in the low luminous intensity and a lo6+wlevel of CO2. | 5 min |
| Elaborate-1 | After explaining to students, the experimental setup that we will determine the effect of light intensity on photosynthesis, detailed information about the subject is conveyed to students with expository teaching and the experiment is done. The light energy emitted by a light source per unit time is called light intensity. Light intensity varies in proportion to the intensity of light and the distance of light from the plant. The effect of light intensity on the rate of photosynthesis increases just like the effect of the amount of carbon dioxide on the rate of photosynthesis, but remains constant after a certain point. Based on this information, we can say that the photosynthesis rate will react differently in long-lived plants and differently in short-lived plants.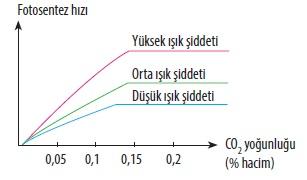 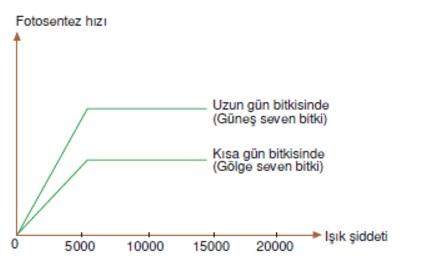 We assume that the light intensity and carbon dioxide together affect the rate of photosynthesis. When an increase is observed in both of them, the rate of the photosynthesis increases, but then it continues steadily. Measuring the Effect of Light Intensity on PhotosynthesisObjective: To create the necessary test environment to measure the effect of light intensity on photosynthesis.In order to perform this experiment, CO2 sensor will be used to measure the decreasing CO2 gas after photosynthesis in 2 different experimental environments illuminated with LEDs with different light intensity. Since the CO2 in the environment is converted to O2 by the plants after photosynthesis, we can say that the light intensity used in the experimental environment is accelerating photosynthesis in any experimental environment. Measuring the CO2 levelInclusion of Mq-135 Sensor in the project: Establishment of electronic and robotic experiment environment in order to observe the changing CO2 level in the environment:Necessary materials:1 x Arduino Uno Robotic Coding Board1 x Breadboard2 x Mq-135 CO2 level measurement sensor10 x Jumper cable1 x 500 Lumen Led Bulb1 x 1500 Lumen Led BulbIntroduction of Mq-135 Sensor and Pin Outputs:It has 4 pins of the Mq-135 sensor we are using. These are VCC, GND, AOUT and DOUT pins. If it is necessary to define its functions: 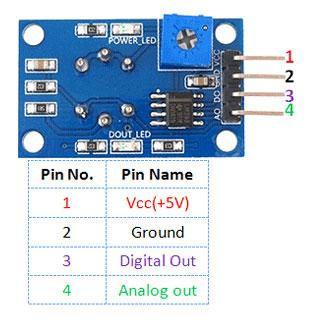 Vcc: Pin to which the voltage required for the operation of the device is given GND: Pin required for the completion of the electrical circuit DOUT: Digital Output Pin of the data from the sensor (0 or 1). AOUT: Analog Output Pin of the data coming from the sensor (0-1024). Making Circuit Connections: First of all, we prepare two experimental environments that we isolate from the external environment as light intensity, light color, CO2 level and temperature. We light the first experiment environment with a 500 Lumen LED bulb, and the second with a 1500 Lumen Led bulb. Since we need to measure the CO2 level of our two experimental environments, we need to make the connections by placing our two CO2 sensors on our Arduino Robotic Board. We connect the Vcc pins of our 1.CO2 sensors to the Vcc (5V) pin, which we get from Arduino, indicated by the red cable as below. Likewise, we connect the GND pins of our CO2 sensors from the Arduino and connect them to the GND pin, which is indicated by a black cable in the figure below.We connect the AOUT pin of our first Mq-135 sensor to the A0 pin of the Arduino with the green cable as shown below, and place this first sensor in the experimental environment where we light it with a 500 Lumen LED. We connect the AOUT pin of our second Mq-135 sensor with the yellow cable to the A1 pin of the Arduino as below figure and place this Second sensor in the experimental environment where we light it with 1500 Lumen LEDs. 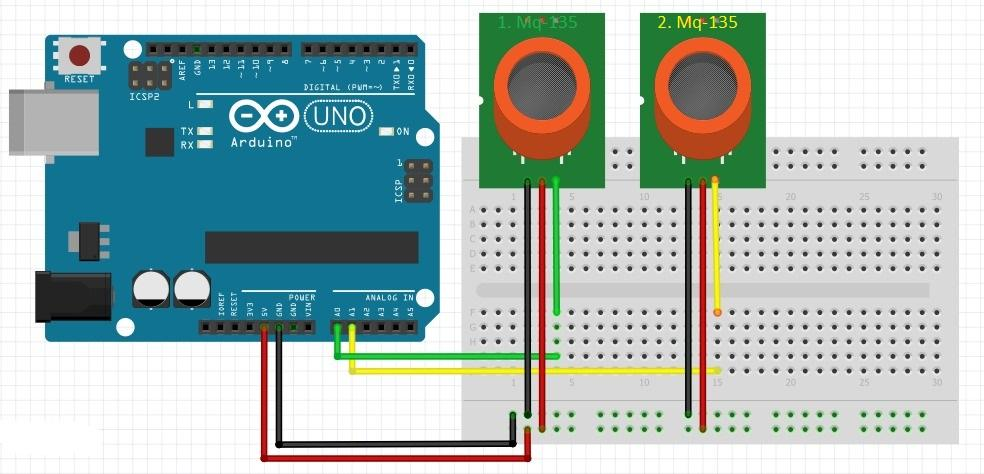 Connection cables diagram between Arduino and Mq-135 Sensors Arduino Mq-1355V ——> Vcc (To activate the device)GND ——> GND (To complete the power circuit)A0 ——> 1. Mq-135 AOUT (To read the data from the sensor)A1 ——> 2. Mq-135 AOUT (To read the data from 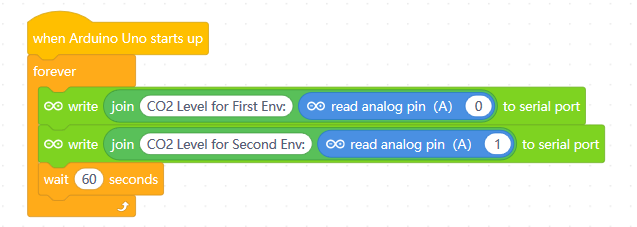 The application we will use for coding is the Mblock program. This application is a tool that allows us to do robotic coding by dragging and dropping blocks without the need for programming language knowledge. The coding block is on top.Application guide: Analog arrow pin (A0) block:Indicates that data from the A0 Analog pin of Arduino is read. Analog arrow pin (A1) block:Indicates that the data from the A1 Analog pin of the Arduino is read Combine block () with ():It is the block that indicates that the text or variables in the second bracket will be combined in the text sent to the computer via USB cable. Write () serial port block:It enables the variable that comes in parentheses to be sent to the computer via serial port (USB cable to the computer). Since there is data from the A0 Analog pin in the parenthesis, the sensor data will go to the computer.  Combine () with () and Write to Serial Port block:It combines what is written in parentheses and sends this value to the Serial port (computer). Here it will combine the “First environment CO2 Level” and the value read from the A0 pin of Arduino (the value from the CO2 sensor) and write to the Serial port (send it to the computer) () sec wait block:When the Arduino Robotic Coding card sees this block, it will wait without doing anything for the given seconds. In our experiment, since we have to get the data every 60 seconds, 60 value was entered into our waiting block.  The block when Arduino Uno starts: This block represents energizing the Arduino Robotic Coding device. It means that code blocks added as a chain will be executed when energized and started to run. Since the “Continuous repeat block” is added as a chain to the “When Arduino Uno starts” block, when the Arduino device is energized, the processes we defined in the “constant repeat block” above will be performed.  | 20 min |
| 5. Evaluation | After 2 different student groups are randomly created by the instructor, they are expected to analyze the result and create a graphic. The aim of the trainer is to transfer the knowledge acquired by the student to the analytical thinking skill. | 10 min |
| X min |
Assessment
Describe here the assessment method of the lesson, if any. For example, if you plan on assessing your students with a quiz, include here questions and answer options with color-coding the correct answers.